Whole Slide Imaging
Sample Digitization, Analysis, and Sharing
Combine smart, all-round scanning solutions with outstanding flexibility.
With the smart scanning solution based on the Metafer software, MetaSystems also offers an extensive toolbox to digitize, analyze, and share larger microscopic samples such as tissue sections. Using sophisticated algorithms, the dedicated software module VSlide for the composition of larger images generates high-quality digital copies of a slide. Such images can provide focus stacks, metadata such as information on the location of cells, and sub-images from different origins. In the viewer module VSViewer, users can create their own annotations, match consecutive tissue sections, generate snapshots from the main image, display different color channels separately on the same screen, and apply contrast enhancement algorithms. Tools within the Metafer software allow users to interpret tissue micro-array cores. The case and image data management software Neon integrates all workflow components and keeps track of the process.
Smart scanning with the VSlide software combines the advantages of a motorized microscope with modern, high-quality imaging automation. The smart scanning workflow is not restricted with respect to magnifications or contrasting modes. It can take advantage of any microscope feature, and it can combine different methods to a smart scanning workflow. Even Z-stacks are automatically acquired and stored in the image files so that the users can virtually 'focus' through the digitized sample.
Imaging with Metafer is very easy. The scanning system managed by the Metafer software automatically reads and interprets bar code labels, and configures the scan according to the information in the code. Pre-scans facilitate tissue detection in bright field, transmitted light, dark field, or any other contrasting method. A high resolution scan can be added either automatically, based on the spatial data obtained in the pre-scan, or on selected regions interactively determined by the researcher.
The virtual slide image is generated automatically in the background while the scanning runs. Parameter sets define the employed color channels and the file format of the final image. Since the source image files are kept, new virtual slides with other parameters can be re-created anytime. VSlide users can choose from a variety of output file formats, including the comprehensive, proprietary VSI format. VSI images contain all relevant image information including color channel details, focus stacks, and annotations. In the local network, VSI images are read with the versatile viewer module VSViewer.
Once a VSI file is created, all the spatial information of the image tiles originally acquired remains accessible. This allows for precise relocation of any sample region under the microscope. Also, subsequent acquisitions of selected regions with different techniques are possible. This unique feature allows for setting up an unlimited number of smart workflows. Regions of interest (e.g., tumor regions in an H&E section) can be easily marked in the viewer module. Once a list of target regions is available, they can be re-scanned anytime with other magnifications, contrasting methods, or other scanning parameters. The selection of regions can even be done remotely, and the tissue matching tool of VSViewer facilitates the transfer of the regions to another sample, e.g., for imaging the same region in subsequent tissue sections.
The free viewing module VSViewer for digital samples scanned by using the Metafer software can be installed on any Windows computer with network access to the image data. The simplified, modern user interface offers all customary viewing tools offered by handy toolbars which can be hidden, minimized, snapped to the window corner, or freely arranged on the desktop. Panning and zooming are done with the mouse and the mouse wheel.
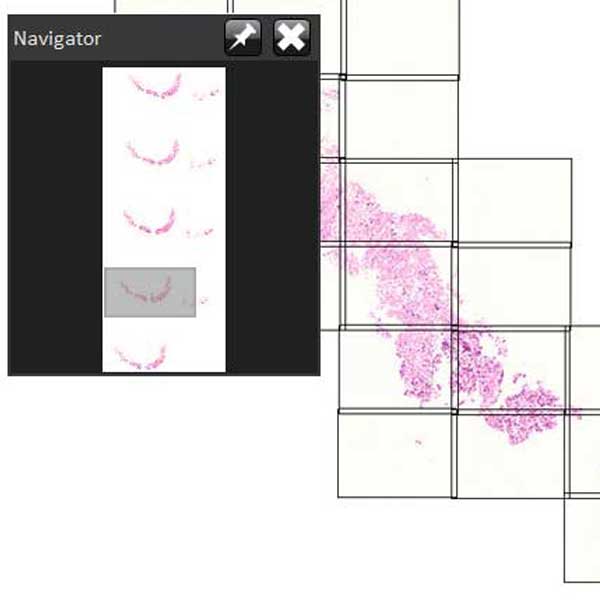
The VSViewer has many options for displaying image metadata. For example, current slide coordinates can be visualized as grids on the image. Also, the location of the fields of view (FOV), that are, the single original camera images, can be shown as an overlay to the image. The navigation bar at the bottom of the screen always provides information on the sample location currently shown. This includes the current magnification, the zoom factor, the focus level (if the current image contains focus stacks), and the slide coordinate of the window center. Quick access buttons allow for selecting a certain magnification, viewing the complete image, and accessing focus levels. Of course, there is also a navigator toolbar showing a thumbnail of the whole image and an indicator of the current section.
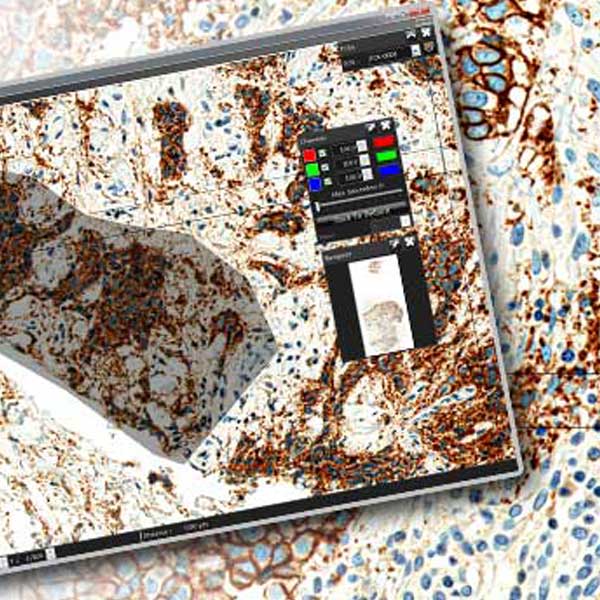
Two annotation toolbars make it easy to highlight regions of interest. The ‘Scan Regions’ toolbar is used to prepare the next scan of a selected part of the sample. A quick selection of the target region generates an annotation file that is directly read by the Metafer SCAN software. The ‘Annotations’ toolbar then offers a comprehensive range of tools to annotate and highlight items in the image. If the current image originates from an object search enabled with the Metafer MetaCyte software, it is even possible to visualize the detected objects within their original vicinity and to group them by any obtained analysis result.
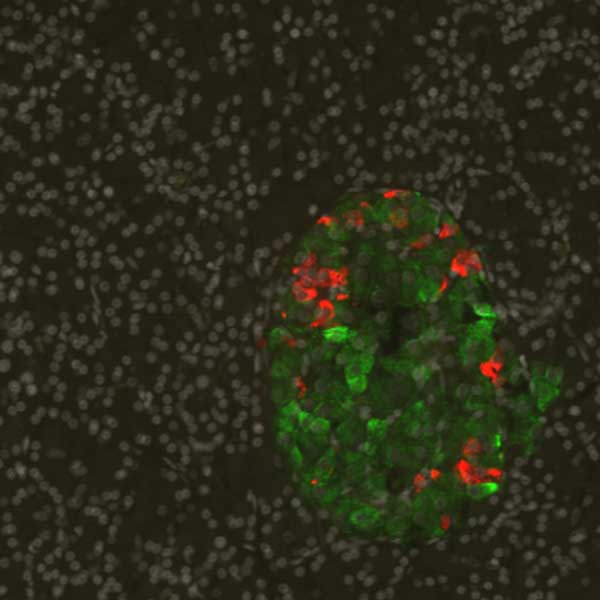
The image window can be split into up to four coupled sections. With the ‘Channels’ toolbar it is then possible to assign different display parameters to each sub-window. Hence, it is possible to visualize the same part of the image with different color channels, overlays, and contrasts. Furthermore, it is possible to open two different images, e.g., from subsequent tissue sections, in two VSViewer software instances that can also be coupled for panning and zooming.
Any view can be exported into standard image file formats (TIFF, JPG, BMP, GIF) as a snapshot. Snapshots may contain additional data such as a magnification ruler, annotations, FOV indications, and even a comment. Additionally, extracts of the image can be interactively defined or by their coordinates, and they can then be saved as a separate image.
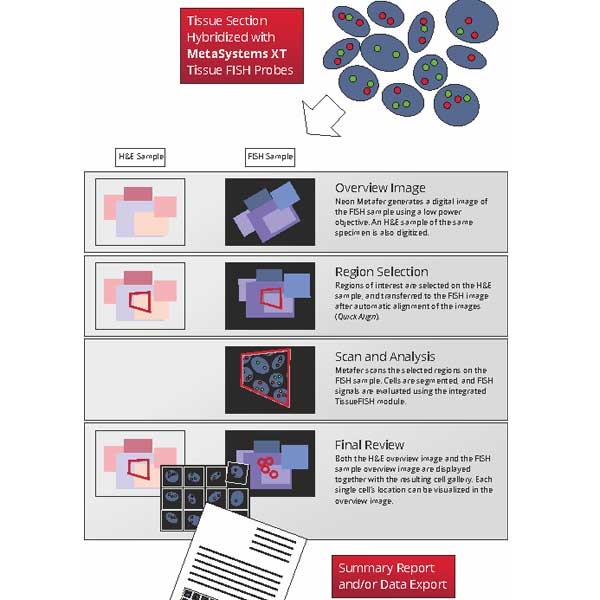
MetaSystems has designed a smart scanning workflow of hybridization and imaging tools to be integrated in the routine workflow of the pathology lab. Core of this solution is the combination of dedicated DNA probes for tissue sections with the innovative scanning facilitated by the Metafer software, merged to a flexible and robust slide scanning with many options.
The integrated scanning system managed by the Metafer SCAN software automatically generates virtual slides in brightfield and fluorescence, acquires high resolution FISH images and provides an automatic score. Equipped with an automated bar code reader and the robust SlideFeeder x80 for up to 800 samples, it can be operated in a 24/7 mode.
- As initial step a digital brightfield, e.g. H&E slide is generated. The pathologist calls up the digital slide and selects on screen the tumor region on the virtual slide that needs to be FISH-scored.
- Next, the FISH slide (from a subsequent section of the same block) is being scanned at low magnification to generate an overview. Displayed side by side to the marked digital H&E image the tumor region can easily be transferred to the FISH slide.
- The Metafer SCAN software now has all the information to start automatic image acquisition of the FISH slide at higher magnification. Cell nuclei that are isolated or slightly connected will be separated automatically and spot-counted. Manual tools for segmentation help to separate touching nuclei for immediate automatic scoring until the preset number of cells to be analyzed has been reached. The software module can be easily set up to match the individual analysis standards. For instance, it is possible to define a minimum number of cells to be analyzed, and also to define a number of independent readers.
More on signal analysis in tissue sections can be seen here. - For final review the software presents a full synopsis to the pathologist, comprising the cell gallery with the scoring results, the virtual DAPI slide showing the positions of analyzed cells, and the corresponding H&E virtual slide. Every cell can be traced back to the tissue section to confirm its location within the preselected tumor region.
- Final results can either be exported as raw data, e.g. for subsequently being processed by external software, or can be summarized in comprehensive, user-adaptable reports.
The laborious nature of procedures, shortages of sample material, and limitations in the cost of reagents for diagnostics in routine clinical pathology has raised the interest in high throughput solutions. The tissue micro-array (TMA) technique addresses these issues by obtaining small tissue cores from regions of interest in paraffin embedded tissues, assembling them in an array-like fashion, and mounting them to a standard glass slide for microscopy. Each of these cores then represents an independent analysis case.
Due to the special layout of samples automation of TMA has to be done based on the following considerations:
- Analysis should take the general layout of the TMA into account,
- It should be possible to correct contortions, rotations, or other spatial aberrations generated during slide preparation,
- Each TMA core should be clearly identifiable by a label,
- Analysis results should be separable so that data can be assigned to the single core.
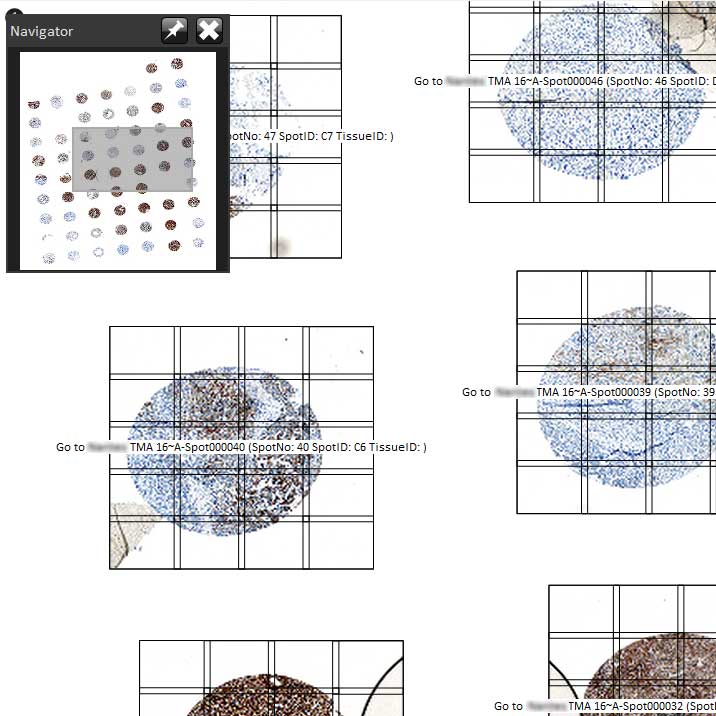
With the unique combination of scanning capabilities facilitated by the Metafer software, the integrated tool for TMA analysis, and the sample digitization software, MetaSystems offers a complete package for precise and effortless automated TMA analyses. Once a tissue microarray (TMA) is created, its layout can be expressed with the number of cores per row, the number of rows in the array, the diameter of the cores, and the distance of cores. In the integrated Metafer TMA tool these values can be used to generate a TMA map file that is used as basis for the analysis. Additionally each core can receive a unique identifier.
A fast pre-scan at low magnification is used to generate a map of the current slide. The result of the pre-scan is displayed side by side with the TMA map, and with a flexible grid the actual image can be matched to the map in order to correct any spatial aberrations. Missing or invalid cores can be marked in this interface. On confirmation the TMA tool converts the data into a position list, which contains the exact positions of each core, and also the core identifiers. The scanning workflow is now ready to re-locate each core and acquire and analyze the core images. If the image stitching software is available, core images are automatically composed in the background and an overview image of the whole TMA is generated.
Metafer 4.3 and Ikaros 6.3 are classified as in vitro diagnostic medical devices (IVD) in the European Union in accordance with In Vitro Diagnostics Regulation (EU) 2017/746 or In Vitro Diagnostic Medical Device Directive 98/79/EC, respectively, and carry the CE label unless otherwise indicated. Use all MetaSystems IVD products only within the scope of their intended purpose.
MetaSystems products are used in many countries worldwide. Depending on the regulations of the respective country or region, some products may not be used for clinical diagnostics.
Some hardware components supplied by other manufacturers are not included in MetaSystems IVD products and are therefore not IVD medical devices.
Please contact us for further information.